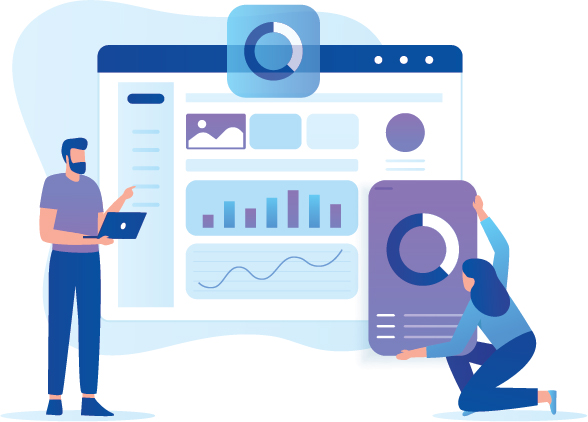
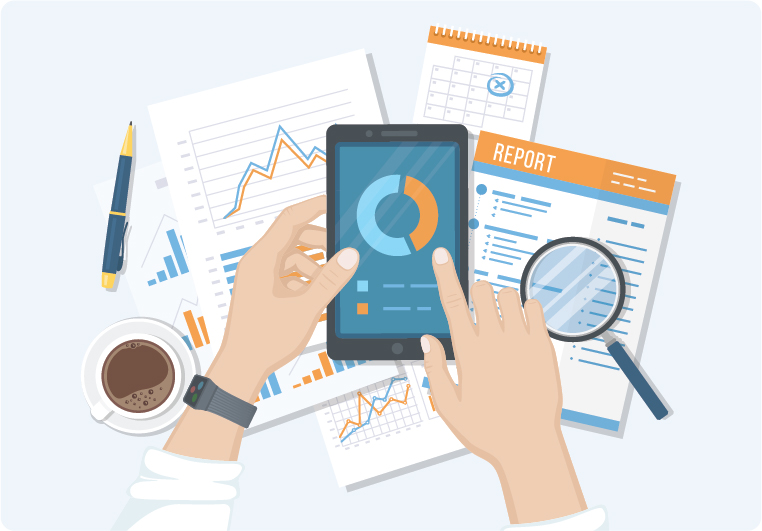
Dashboards serve as powerful tools for data visualization, analysis, and decision-making across every organization.
They enable stakeholders to gain insights into their data, track performance, and drive organizational success.
Visualization: Dashboards use visual elements such as Key Performance indicators, charts, graphs to represent data, making it easier for users to comprehend and analyse.
Real-time Data: Our dashboards display real-time data, providing users with up-to-date information for decision-making.
Centralized Information: Dashboards serve as a centralized platform for aggregating and displaying information from various sources across the factory, including IoT devices, sensors, and databases.
Performance Analysis: Dashboards enable users to analyse historical data and trends to identify patterns and insights.
